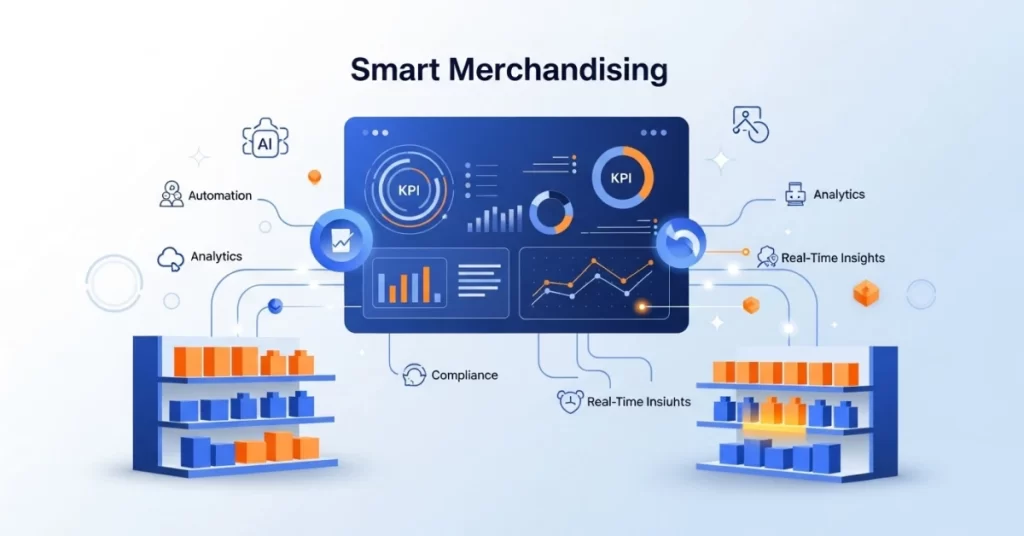



Image recognition in the CPG market refers to the deployment of deep learning–based computer vision systems that automatically detect, classify, and measure individual SKUs on retail shelves. These systems quantify share of shelf, planogram compliance, and on-shelf availability across thousands of store locations simultaneously, replacing error-prone manual audits with real-time, actionable intelligence.
Table of Contents
- What Is Image Recognition in the CPG Market?
- Global Market Size, Share & Growth Forecast (2025–2035)
- Core Technology Stack: How Image Recognition Works in CPG
- Key Application Areas Across the CPG Value Chain
- Shelf Intelligence & Planogram Compliance
- AI-Powered In-Store Execution
- Image Recognition Maturity Model for CPG Companies
- Leading Vendors, Platforms & Competitive Landscape
- Regional Market Analysis
- Challenges, Limitations & Regulatory Considerations
- Future Trends: What’s Next for Image Recognition in CPG
- Implementation Roadmap for CPG Brands
- Frequently Asked Questions (FAQ)
1. What Is Image Recognition in the CPG Market? A Technical Foundation
1.1 Defining Image Recognition vs. Computer Vision in a CPG Context
Computer vision is the broad scientific discipline that enables machines to interpret visual data. CPG-specific image recognition is a narrow, high-precision application of that discipline — one that demands product-level granularity far beyond what generic object detection provides.
A general-purpose computer vision model can identify that a shelf contains “bottles.” A CPG image recognition system must distinguish between a 12 oz. Coca-Cola Classic, a 12 oz. Coca-Cola Zero Sugar, and a 20 oz. Coca-Cola Cherry — each treated as a discrete SKU with its own planogram slot, price point, and compliance rule.
This precision requires:
- Fine-grained visual classifiers trained on tens of millions of product images, including label variants, packaging refreshes, and regional SKU differences
- Bounding-box regression heads (e.g., YOLO v8, Faster R-CNN, DETR architectures) capable of detecting partially occluded or angled facings
- Product catalog integration that maps visual detections back to GTIN/UPC identifiers in real time
- Contextual shelf parsing — understanding shelf structure, bay geometry, and vertical/horizontal positioning relative to planogram slots
As Trax Retail documents, CPG image recognition systems must process images captured under highly variable real-world conditions: inconsistent store lighting, shopper occlusion, tilted camera angles, and packaging glare — all while maintaining SKU-level accuracy at scale.
[Image Suggestion: Side-by-side comparison of generic object detection output vs. CPG-specific SKU-level bounding box detection on a beverage shelf. Alt text: “CPG image recognition SKU detection vs. generic computer vision comparison.” Title: “SKU-Level Precision in CPG Image Recognition”]
1.2 The CPG Retail Execution Problem Image Recognition Solves
The scale of the CPG retail execution challenge is staggering:
- A single top-10 CPG manufacturer may distribute 50,000+ active SKUs across 500,000+ retail locations globally
- A field sales representative can physically audit 8–12 stores per day, capturing a static snapshot that is obsolete within hours
- Manual shelf audits carry an average accuracy rate of 60–70% due to human inconsistency, time pressure, and cognitive load
- Out-of-stock (OOS) events cost the global retail industry an estimated $1 trillion annually, with CPG brands absorbing the majority of that revenue loss
Traditional audit approaches fail on three axes simultaneously:
| Audit Dimension | Manual Field Audit | Image Recognition |
|---|---|---|
| Coverage frequency | 1–4× per month per store | Continuous / daily |
| SKU detection accuracy | 60–70% | 92–98% (leading platforms) |
| Time to insight | 24–72 hours post-visit | < 2 minutes post-capture |
| Cost per store visit | $25–$80 (labor + travel) | $0.10–$0.50 (per image analysis) |
| Data granularity | Aggregate category level | Individual facing, shelf, bay |
| Scalability | Linear (headcount-constrained) | Near-infinite (cloud-elastic) |
Image recognition eliminates the frequency-accuracy-cost trilemma by enabling any smartphone-equipped field rep, retail associate, or IoT shelf camera to generate audit-grade data at every store visit or on a continuous basis.
According to Space Planning Global, even leading CPG adopters are capturing only a fraction of the potential value — the technology’s surface has barely been scratched in terms of coverage density and analytical depth.
1.3 Key Performance Indicators (KPIs) Image Recognition Measures in CPG
Image recognition platforms generate a structured KPI hierarchy, each tier mapping directly to a revenue impact mechanism:
Tier 1 — Availability KPIs
- On-Shelf Availability (OSA): Percentage of planogram slots containing the correct SKU at the time of measurement. A 1-percentage-point improvement in OSA typically drives a 0.5–1.0% uplift in category sales.
- Out-of-Stock (OOS) Rate: Proportion of expected facings that are empty. Industry benchmark: OOS rates average 8.3% globally (ECR Europe data), spiking to 15–20% during promotional periods.
- Void Detection: Identification of SKUs that are ranged (listed) but absent from the shelf entirely — distinct from OOS, which implies temporary depletion.
Tier 2 — Visibility KPIs
- Share of Shelf (SOS): The percentage of total shelf facings occupied by a brand’s products within a defined category. Directly correlates with purchase intent; research shows SOS above 30% in a category triggers disproportionate shopper attention.
- Facing Count: Absolute number of product faces visible to the shopper per SKU, per shelf. The primary metric for negotiating retailer shelf agreements.
- Shelf Position Score: Vertical and horizontal placement quality (eye-level = premium; floor-level = penalty) expressed as a weighted index.
Tier 3 — Compliance KPIs
- Planogram Compliance Score (PCS): Percentage of SKUs in their correct planogram position. Industry average PCS sits at 60–65%; best-in-class CPG brands achieve 85%+.
- Promotional Display Compliance: Whether secondary displays (end caps, floor stands, clip strips) are erected, correctly stocked, and properly positioned per trade agreement terms.
- Price Tag Accuracy: Verification that shelf-edge labels match the agreed promotional or everyday price — critical for trade spend ROI measurement.
Tier 4 — Competitive Intelligence KPIs
- Share of Assortment: Brand’s listed SKUs as a percentage of total category SKUs present on shelf.
- Competitor SOS Tracking: Real-time benchmarking of competitor facing counts within the same category frame.
1.4 The CPG Image Recognition Data Lifecycle
Every image recognition deployment in CPG follows a six-stage data lifecycle with distinct latency, compute, and governance requirements at each stage:
Stage 1 — Image Capture (0–5 seconds)
- Source: Smartphone camera (field rep), fixed IoT shelf camera, autonomous retail robot, or drone
- Requirements: Minimum 12MP resolution; controlled overlap (15–20% between adjacent frames for panoramic stitching); EXIF metadata (store ID, GPS, timestamp, user ID) embedded at capture
- Key challenge: Ensuring consistent capture protocol across thousands of field reps without over-constraining workflow
Stage 2 — Preprocessing (0.5–3 seconds)
- Operations: Image deblurring, exposure normalization, lens distortion correction, panoramic stitching (if multi-frame)
- Execution: On-device (edge) for latency-sensitive workflows; cloud for batch processing
- Output: Normalized image tensor ready for model inference
Stage 3 — Model Inference (0.1–8 seconds depending on deployment)
- Cloud IR: Full model inference on GPU cluster; highest accuracy; 2–8 second round-trip latency
- On-Device IR: Quantized model (INT8/FP16) running on mobile NPU; 0.1–0.5 second latency; operates offline
- Output: Structured JSON payload — bounding boxes, SKU IDs, confidence scores, shelf coordinates
Stage 4 — Insight Generation (1–30 seconds)
- KPI computation engine aggregates detection outputs against planogram master data and product catalog
- Anomaly detection flags OOS events, compliance violations, and pricing discrepancies
- Output: Structured insight objects with severity scoring and recommended actions
Stage 5 — Action Triggering (real-time to 24 hours)
- Immediate: Push notification to field rep’s device (“Restock SKU X in